Alt-CV
/Posted on 13 August 2014
It’s that time of year again… time to update the old CV. While I was at it, I decided to try a couple of visualizations in addition to the ordinary, eye-glazing text version. Here they are.
The first is a bar graph of publications and citations by year and job, subdivided by type of publication. The y-axis on the left numbers the pubs, the y-axis on the right the cites:
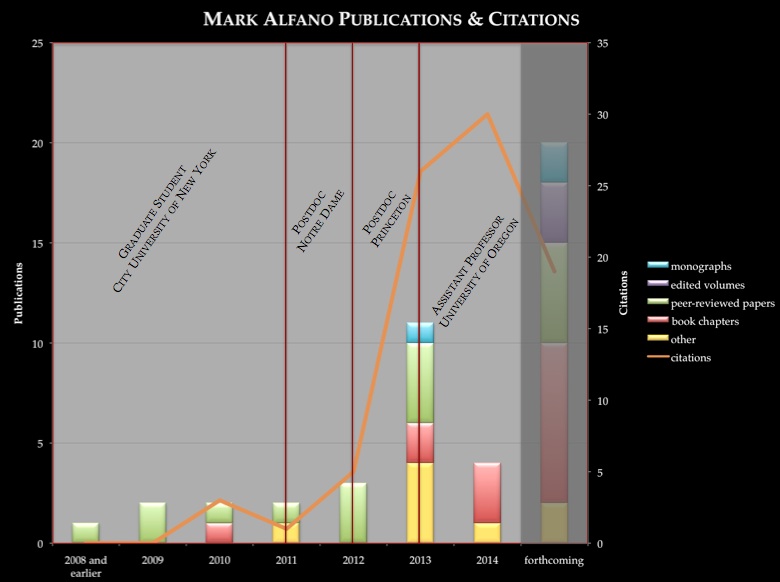
Bar graph
The second is the same graph in cumulative form:
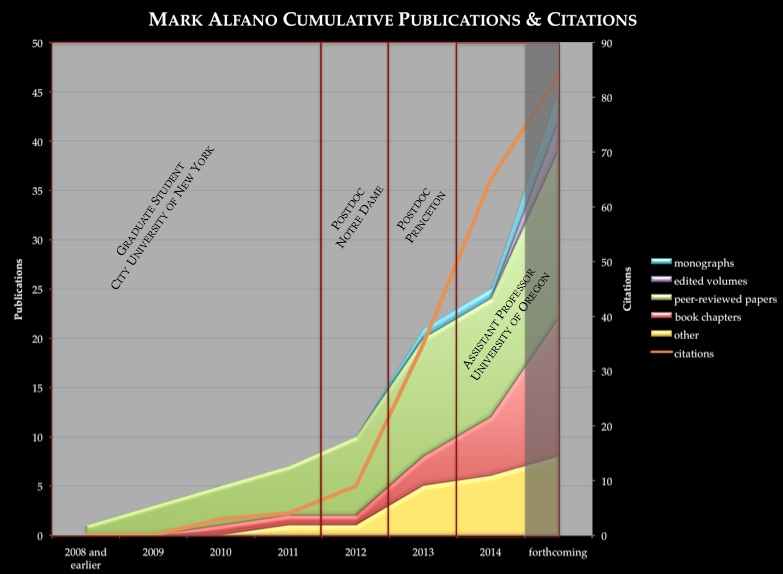
Bar graph - cumulative
The third is a “publication signature”: basically, a representation of how many pubs I have in each of the areas I work in (excluding areas like aesthetics where I have only one pub). I haven’t decided yet whether it makes since to try to include citations in this one. Key them to what I think the pub is about? Or to the area in which the citing pub is focused? Probably best not to include at all. Publications that are substantially in multiple areas (e.g., a paper on Nietzsche’s moral psychology) get double- or triple-counted. The axis on this one is logarithmic.

Publication signature


Mark Alfano. Cambridge University Press (2013).